Drag-and-drop, visual design of reports
Easy to use, multiply efficiency.
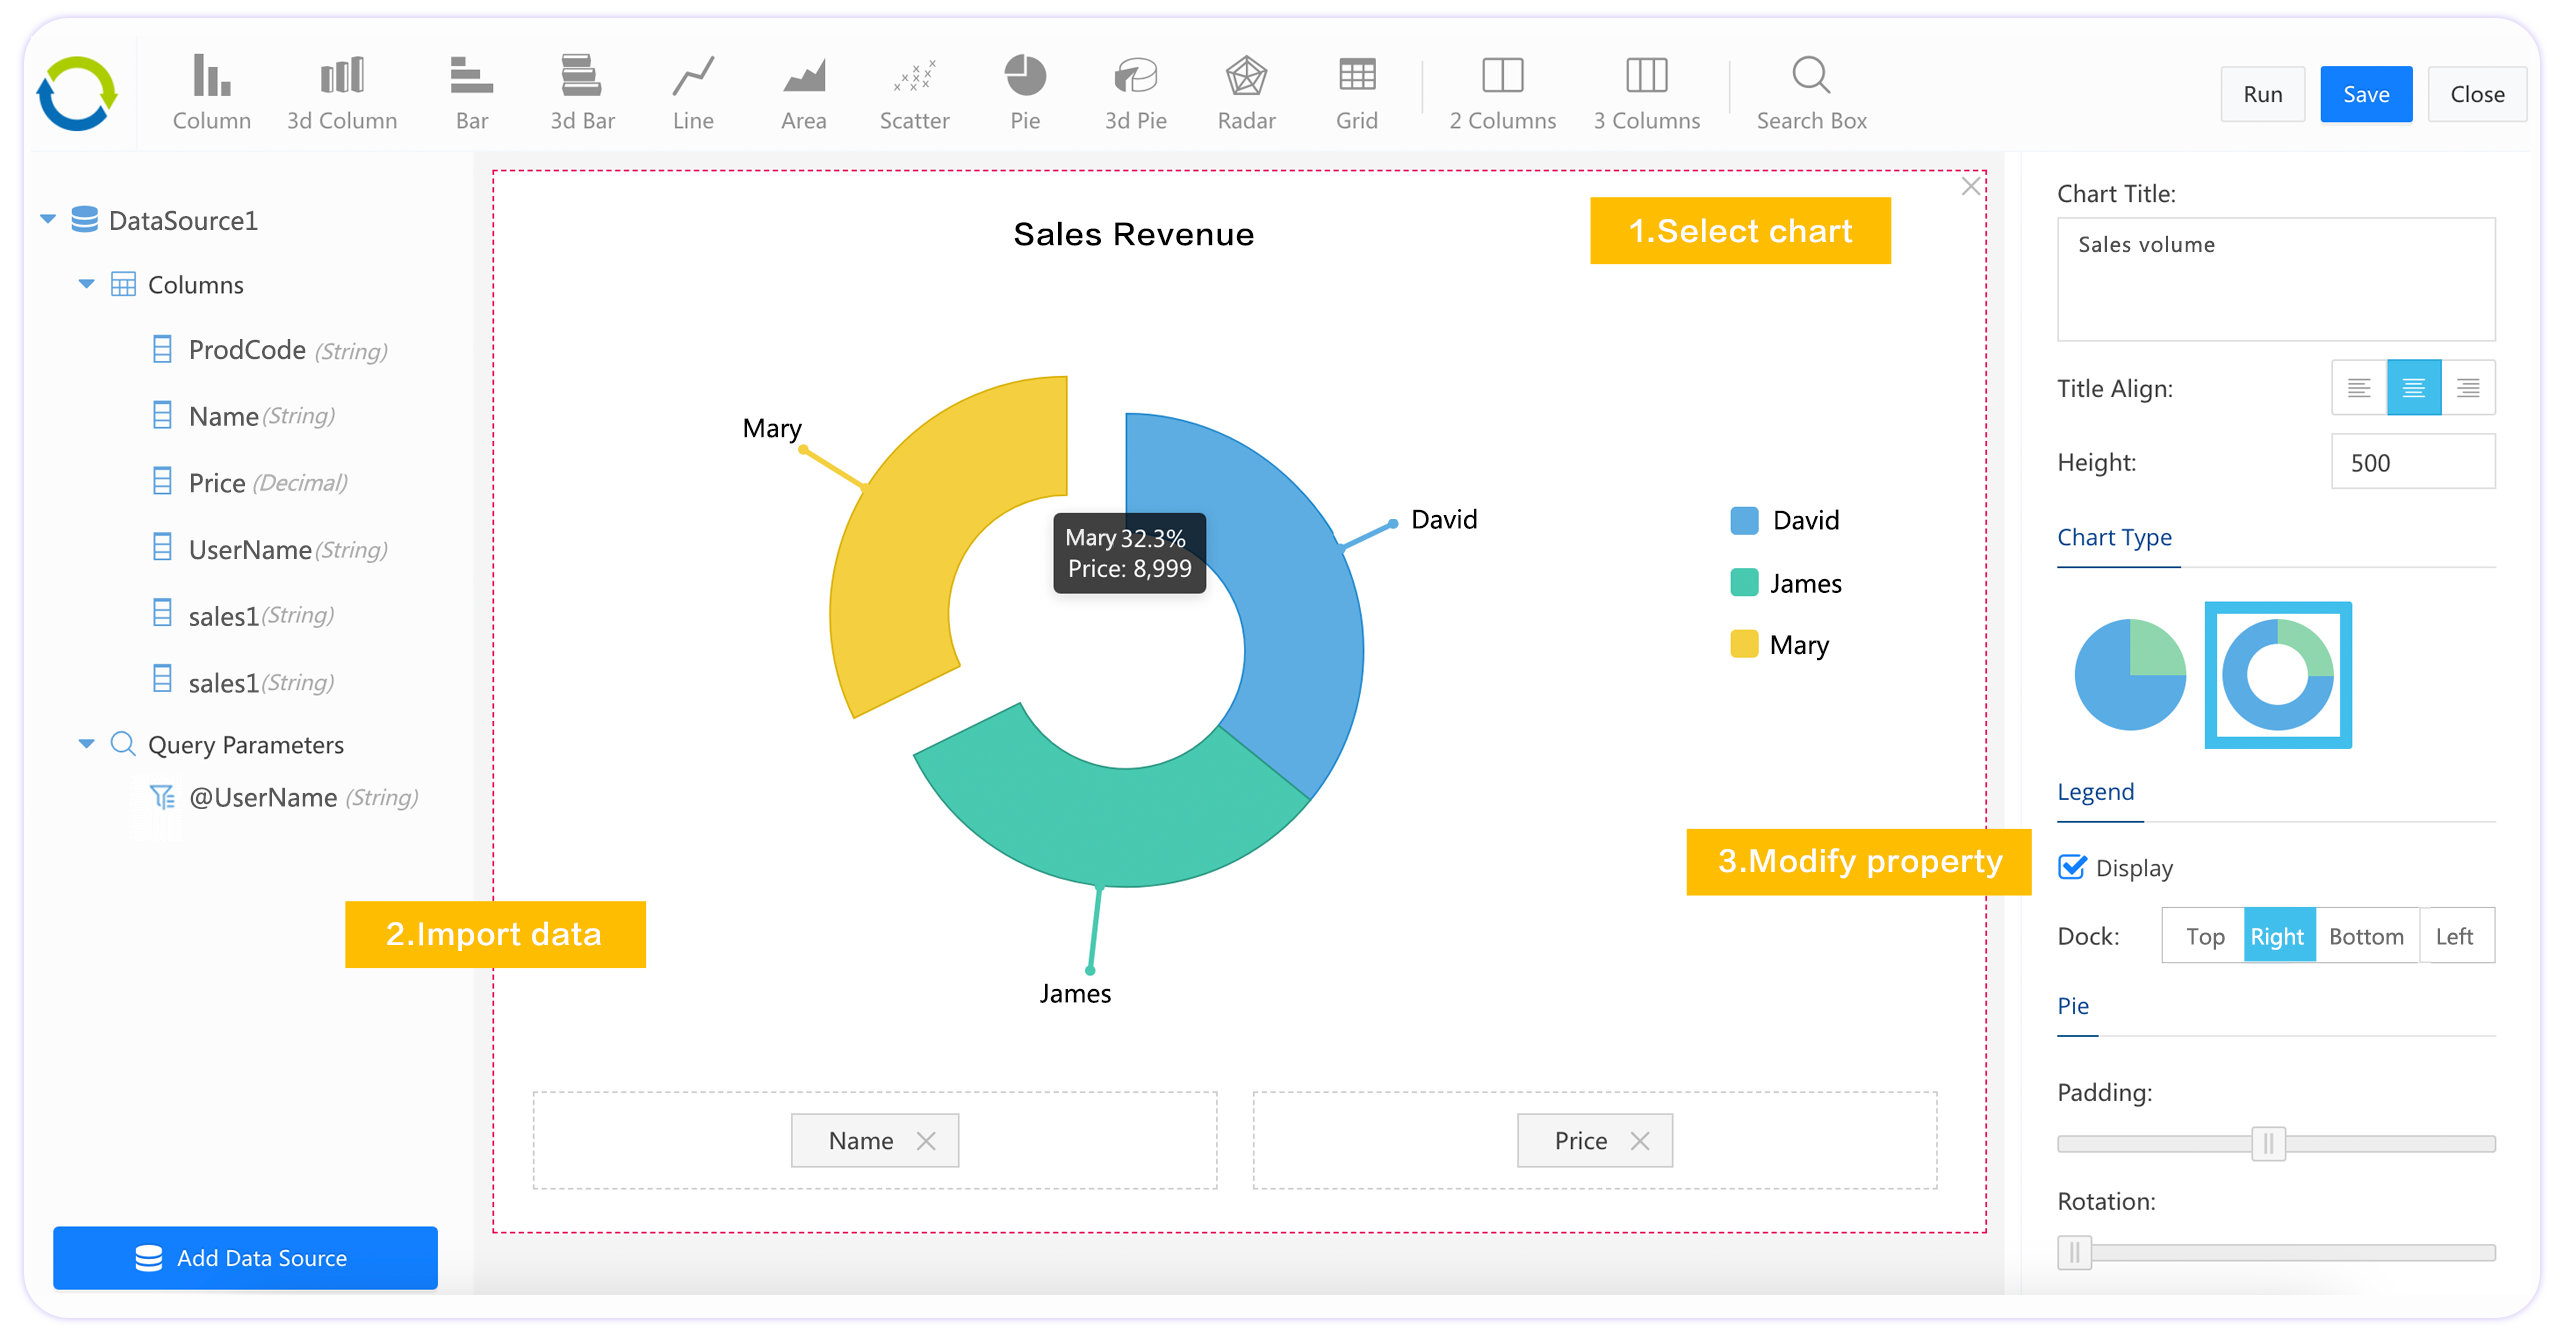
Rich charts
Bar, 3D bar, column, 3D column, pie, 3D pie, line, area, radar, scatter, grid, etc.
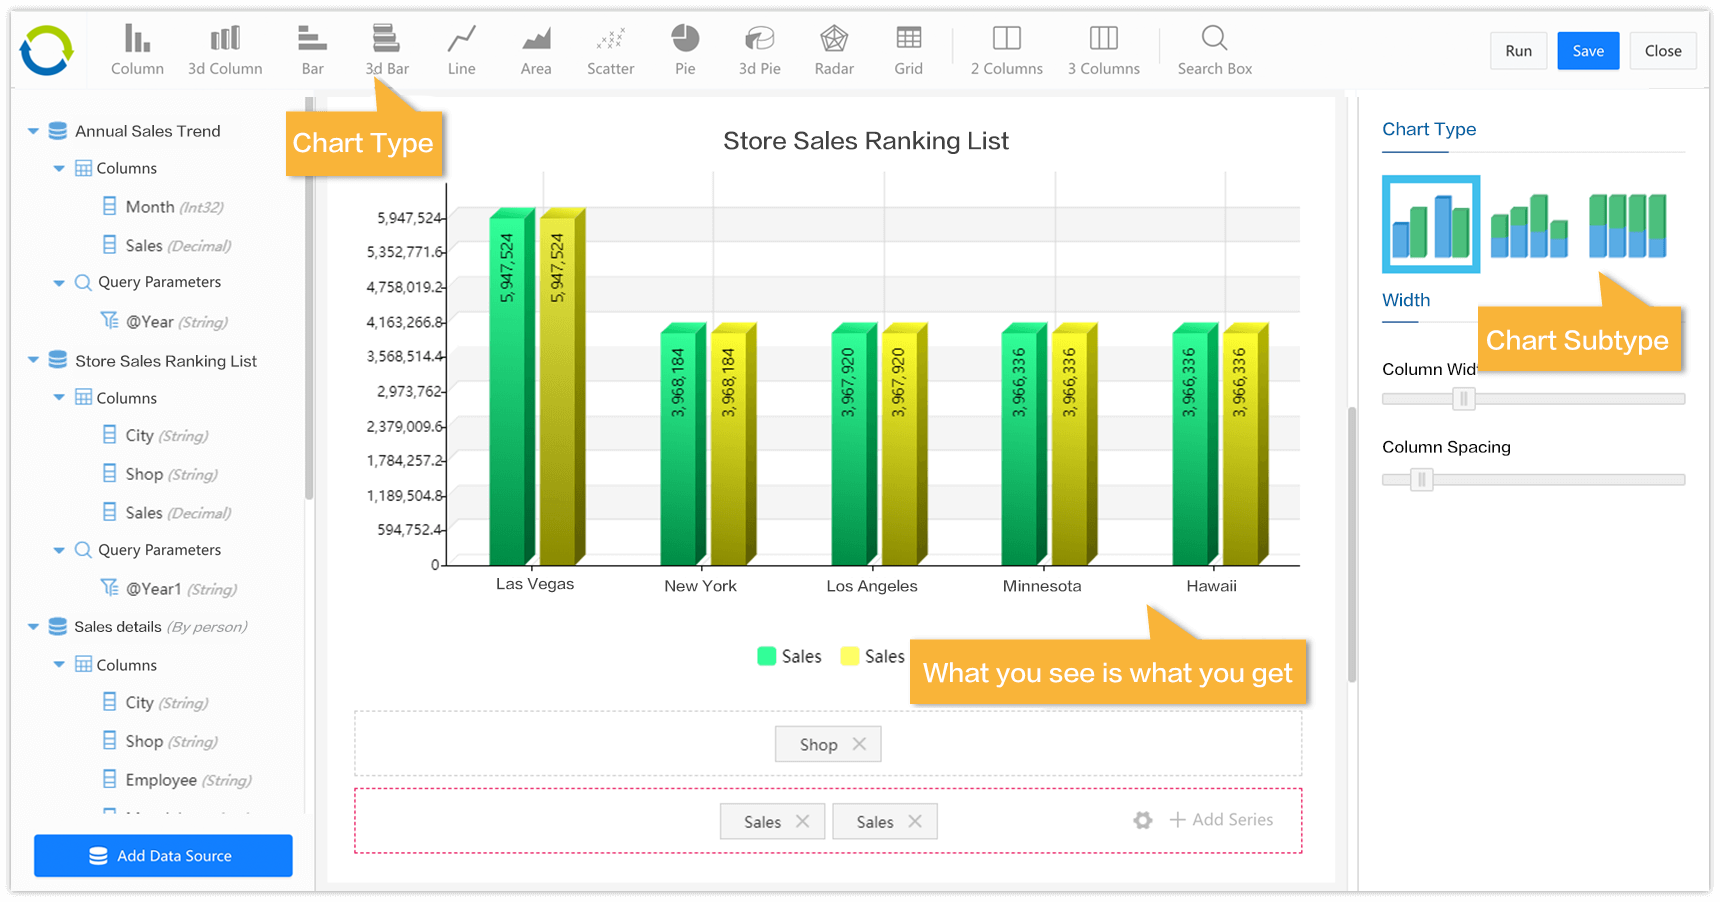
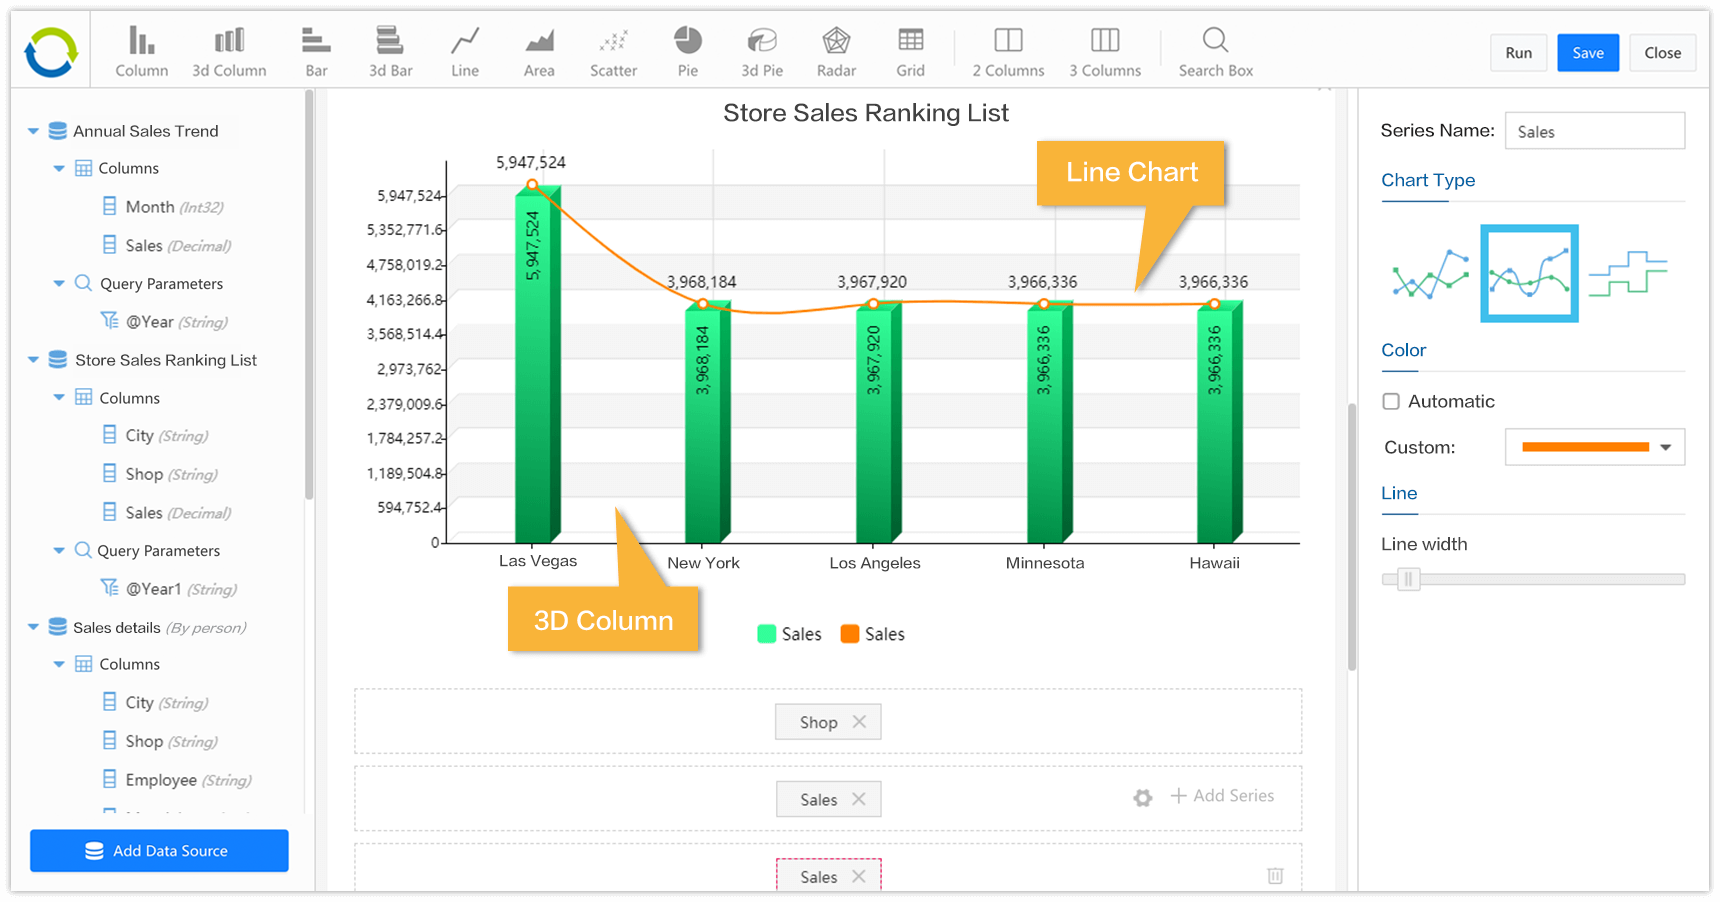
Multi-series charts
Chart components support multi-series and enable drag-and-drop design.
Dashboard
By using layout components, multiple charts can be combined into a dashboard.

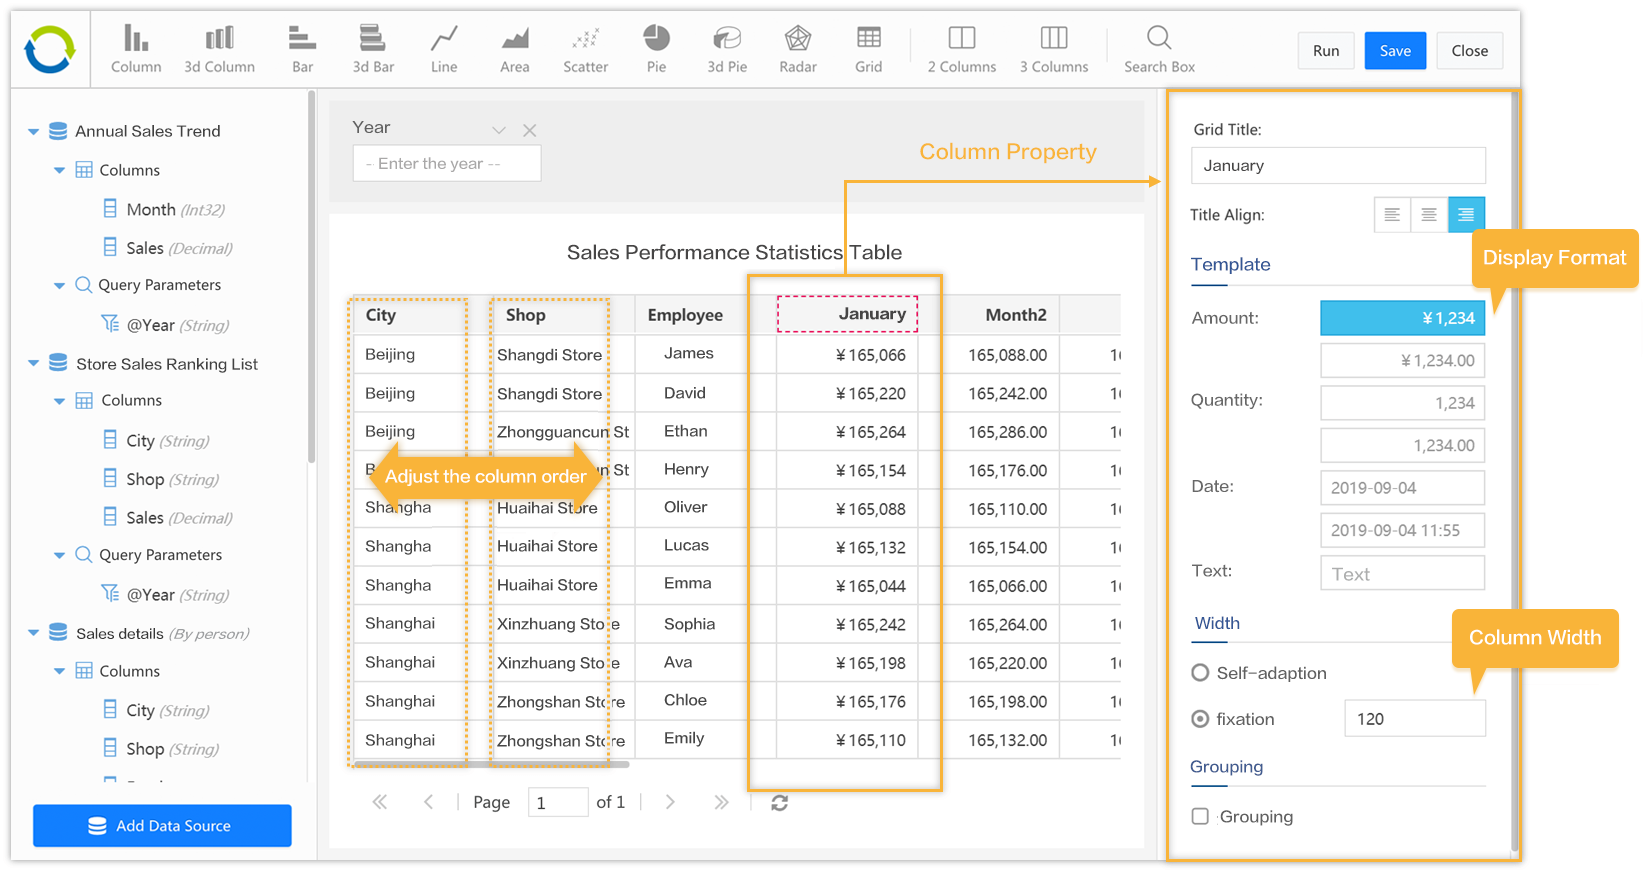
Detailed table
The width, alignment, format, etc. of each column in the grid all support visual configuration.
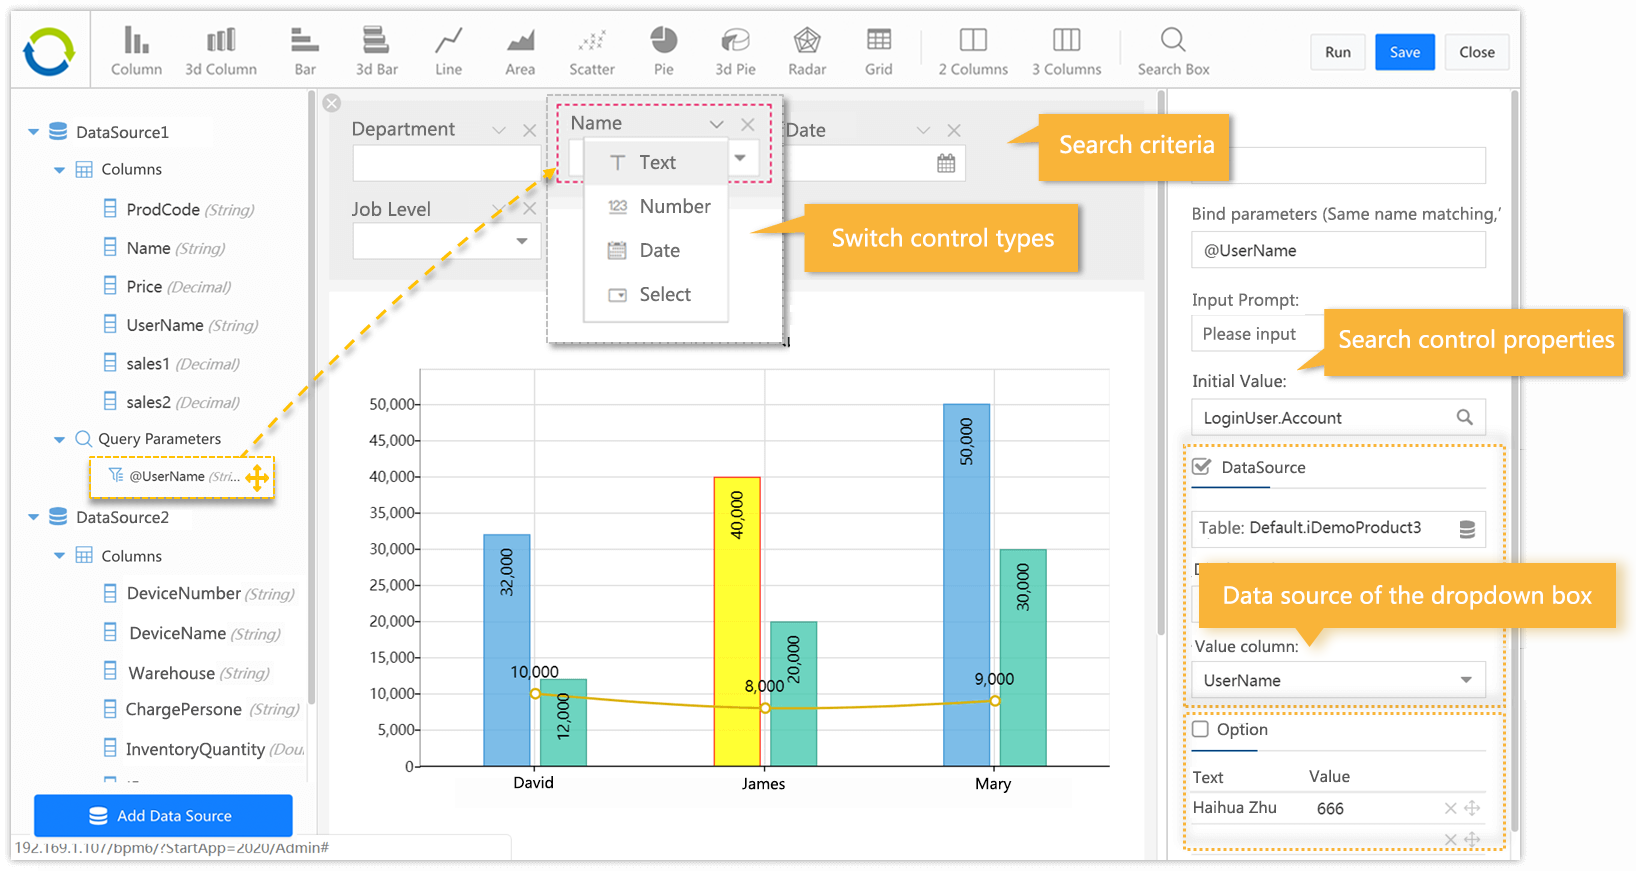
Configure the report search panel
Zero code, visual configuration.
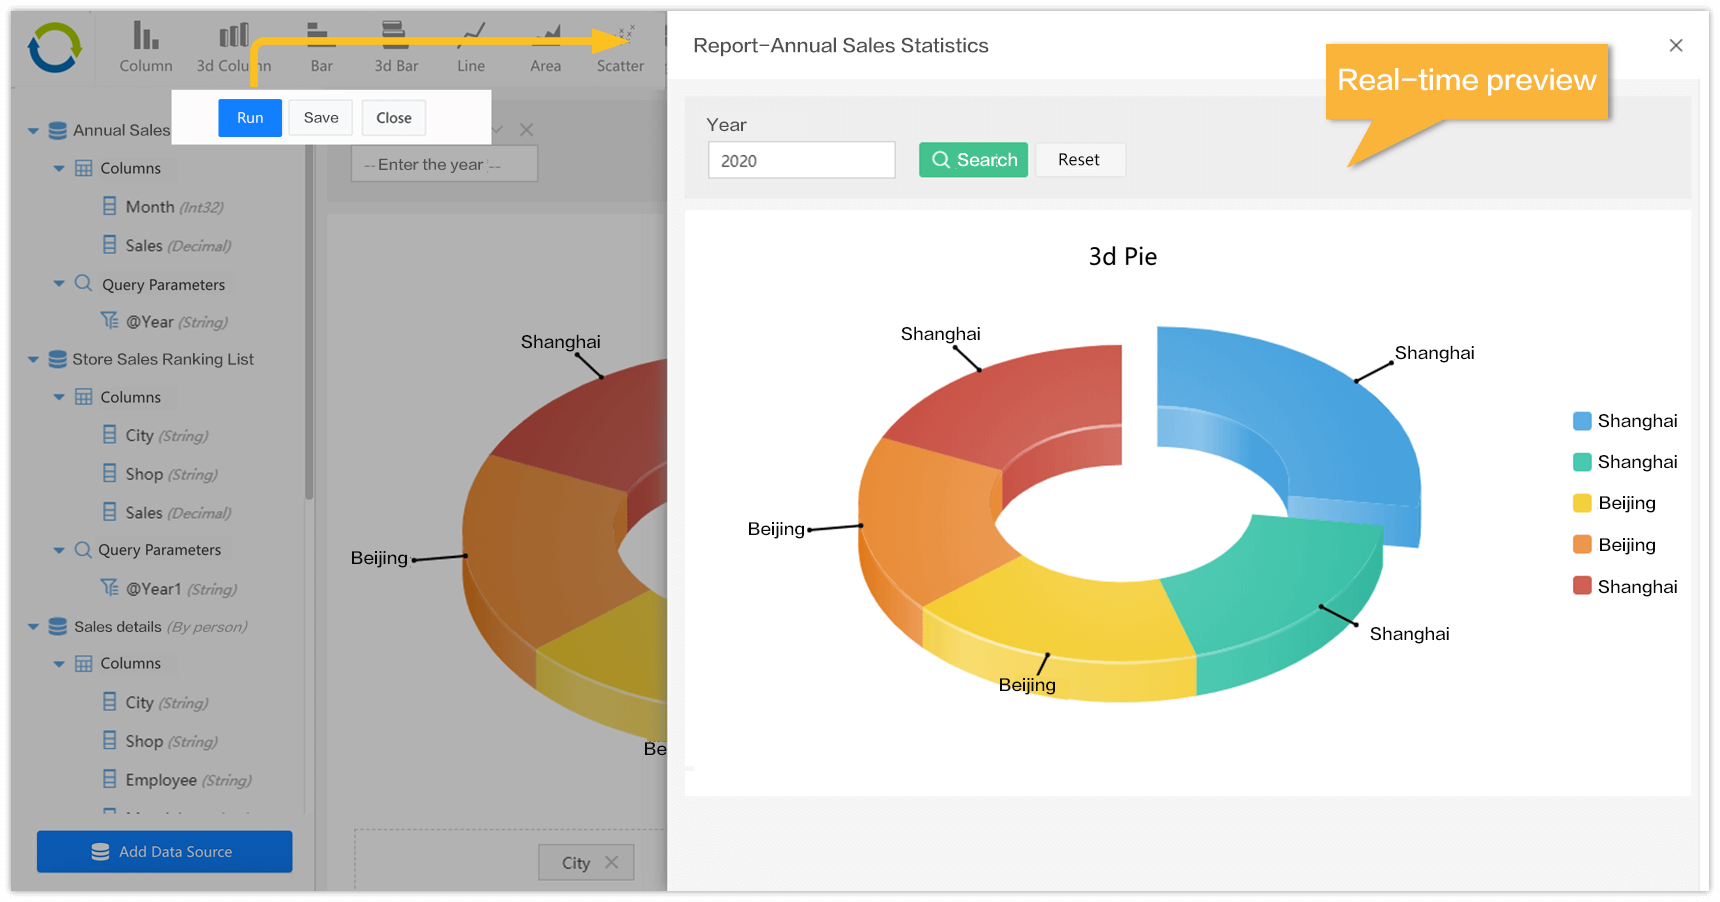
Design preview
Eliminating the need to switch back and forth between modules and improving efficiency.
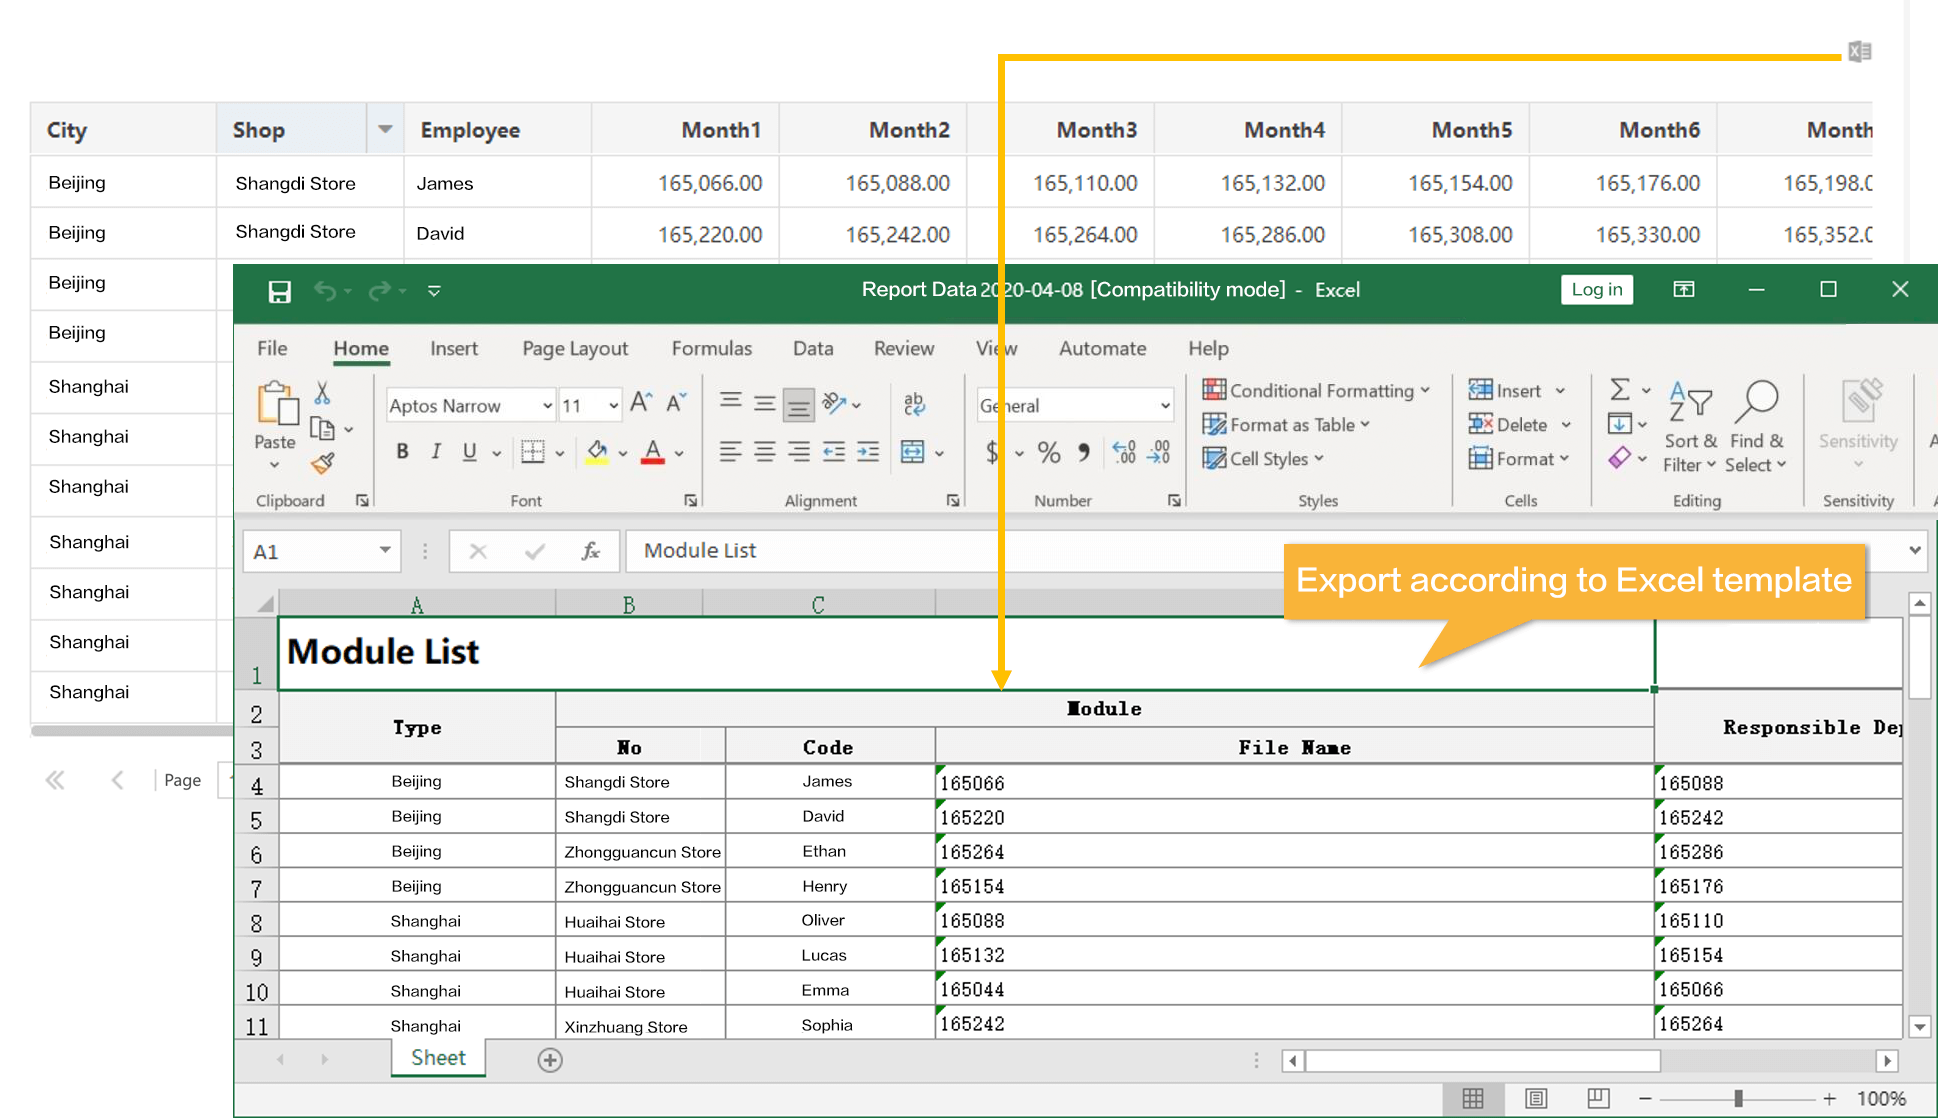
Template-based export
Can be exported to the specified template. Once the export is done, all charts within the template will be applied automatically.